|
10 minutes maximum An IB Periodic Table and data booklet is required. |
||||||||||||||||||||||
| 1. In an experiment to determine the empirical formula of magnesium oxide, a piece of magnesium ribbon of mass 0.50 ± 0.01 g was heated in a crucible to form magnesium oxide. The mass of the product was measured and the percentage composition of magnesium and oxygen in the final product was then calculated. What is the best way to reduce the systematic error in this experiment? | ||||||||||||||||||||||
| ||||||||||||||||||||||
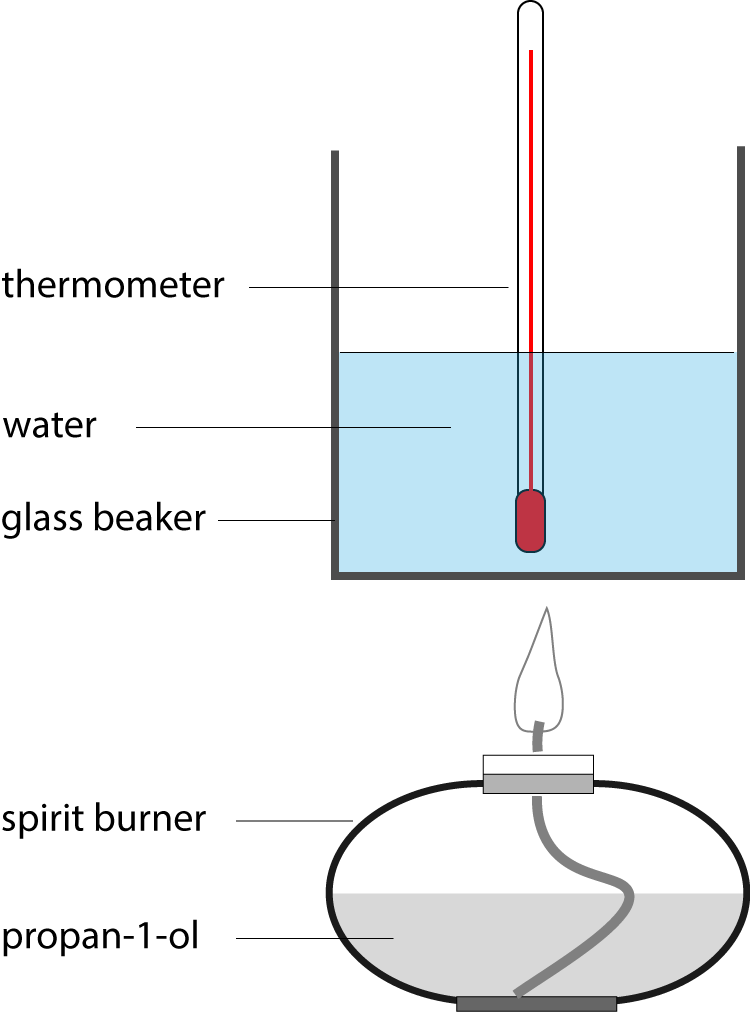
2. In an experiment to measure the enthalpy change of combustion of |
 |
|||||||||||||||||||||
|
||||||||||||||||||||||
3. An experiment was set up to measure the potential difference of a voltaic cell, as shown in the diagram below, with a zinc half-cell and a copper half-cell.
The literature value for the potential difference is 1.10V under standard conditions. The experiment was repeated 3 times using new strips of metals each time and potential differences measured was 1.37V, 1.39V and 1.38V. How would you describe the accuracy and precision of these results? |
||||||||||||||||||||||
| ||||||||||||||||||||||
4. The literature value of the enthalpy change of the reaction 2KHCO3(s) → K2CO3(s)+H2O(l)+CO2(g) is +70.0 kJ mol-1. The experimentally measured value is +45.7 kJ mol-1. What is the percentage error in this experiment?
| ||||||||||||||||||||||
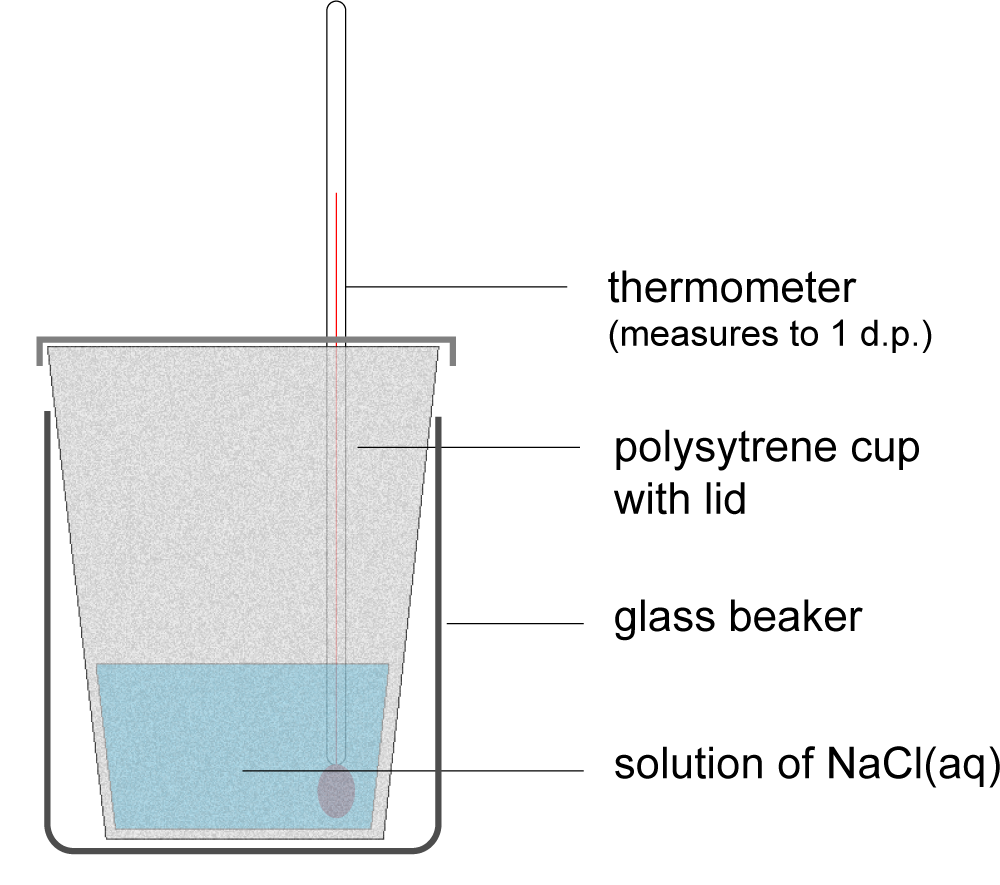
5. In an experiment to measure the enthalpy change of solution of sodium chloride, as shown in the diagram, which of the following statements about errors is correct?
|
 |
|||||||||||||||||||||
| ||||||||||||||||||||||
| 6. An investigation is carried out in order to study the effect of concentration of the reactant on the rate of hydrogen peroxide decomposition:
2H2O2(aq) → 2H2O(l) + O2(g) Which of the following is correct about the variables in this experiment? |
||||||||||||||||||||||
| ||||||||||||||||||||||
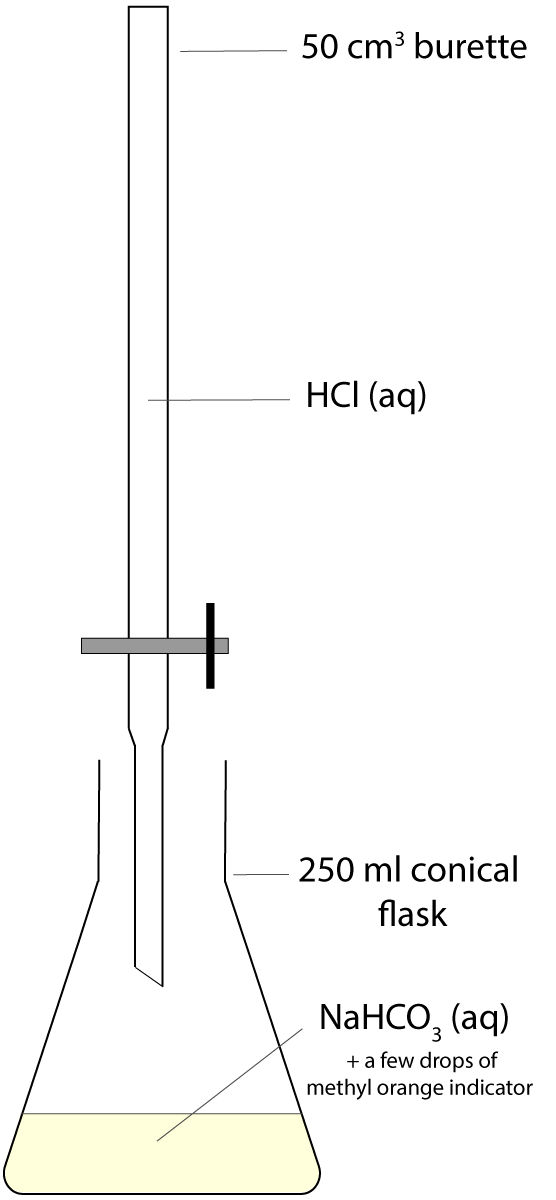
Questions 7-9 are about a titration experiment, in which a standard solution of sodium hydrogen carbonate NaHCO3(aq) was used to find the concentration of an unknown hydrochloric acid HCl(aq) solution. The set-up is shown in the diagram and methyl orange was used as an indicator. A rough trial was carried out at the beginning and then three titrations were done carefully, adding the acid solution dropwise near the end point. The raw data are shown in the table below.
The smallest division on the 50cm3 burette is 0.1 cm3. |
 |
|||||||||||||||||||||
7. What is the percentage uncertainty in the titre from trial 2?
| ||||||||||||||||||||||
8. Trials 1-3 produced concordant titre results and they were used to calculate the mean titre of the acid solution. Select the correct mean titre with its absolute uncertainty.
| ||||||||||||||||||||||
9. The concentration of the sodium hydrogencarbonate standard solution NaHCO3(aq) was 0.096 mol dm-3, and its volume was measured using a 25.00 ± 0.06 cm3 pipette. When calculating the concentration of the acid solution HCl(aq), how should its uncertainties be calculated? |
||||||||||||||||||||||
| ||||||||||||||||||||||
| 10. Which of the following graphs correctly represent the relationship between pressure P and volume V for an ideal gas when the temperature of the gas and the mole of the gas remain constant?
|
||||||||||||||||||||||
|
||||||||||||||||||||||